Transdermal Optical Imaging (TOI):Clinical Accuracy & Reliability Summary
A comprehensive analysis of TOI technology for measuring physiological and emotional parameters through non-invasive facial scanning.
Introduction
Overview of Transdermal Optical Imaging (TOI) technology and its applications
This document provides an overview of Transdermal Optical Imaging (TOI) Data Quality Tests. TOI is a non-invasive technology that uses conventional cameras to extract blood flow information from the face to measure various physiological and emotional parameters.
Heart Rate & Mental Stress Index
Tests on the data quality of Heart Rate (HR) and Mental Stress Index (MSI) were carried out in a normal and indoor environment. These measurements provide insights into cardiovascular function and stress levels.
Breathing
Tests on the data quality of breathing were carried out in a normal and indoor environment. Breathing rate is an important vital sign that can indicate respiratory health.
Blood Pressure
Tests on the data quality of blood pressure (BP) were carried out in a controlled indoor environment. Blood pressure is a critical vital sign for cardiovascular health assessment.
Cardiovascular Disease Risk Prediction
This tool calculates an individual's probability of having a first heart attack, first stroke, or first heart attack or stroke (which we term 'cardiovascular disease') within a specified number of years.
Emotions
Tests on the data quality of emotions (happiness, sadness, fear, disgust, surprise, and anger) were carried out using videos of individuals expressing various genuine and posed emotions.
Methods
Detailed methodology for testing TOI technology across different parameters
Heart Rate & Mental Stress Index
Tests on the data quality of HR and MSI were conducted in Hangzhou, China and Toronto, Canada. All tests were conducted by researchers with experience in data collection, signal processing, and machine learning.
Figure 1: Heart Rate & Mental Stress Index Test Setup
Test Population: Heart Rate, Mental Stress Index
Over 10,000 test subjects took part in the test. The subjects were recruited from the Affiliated Hospital of Hangzhou Normal University in China and the University of Toronto in Canada. There were no exclusion criteria when recruiting participants, although most participants were healthy adults above 18 years of age.
Table 3: Characteristics of population for HR and MSI
| Participants Composition | Value |
|---|---|
| Standard deviation of age | 15.2 |
Test Setup: Heart Rate & Mental Stress Index
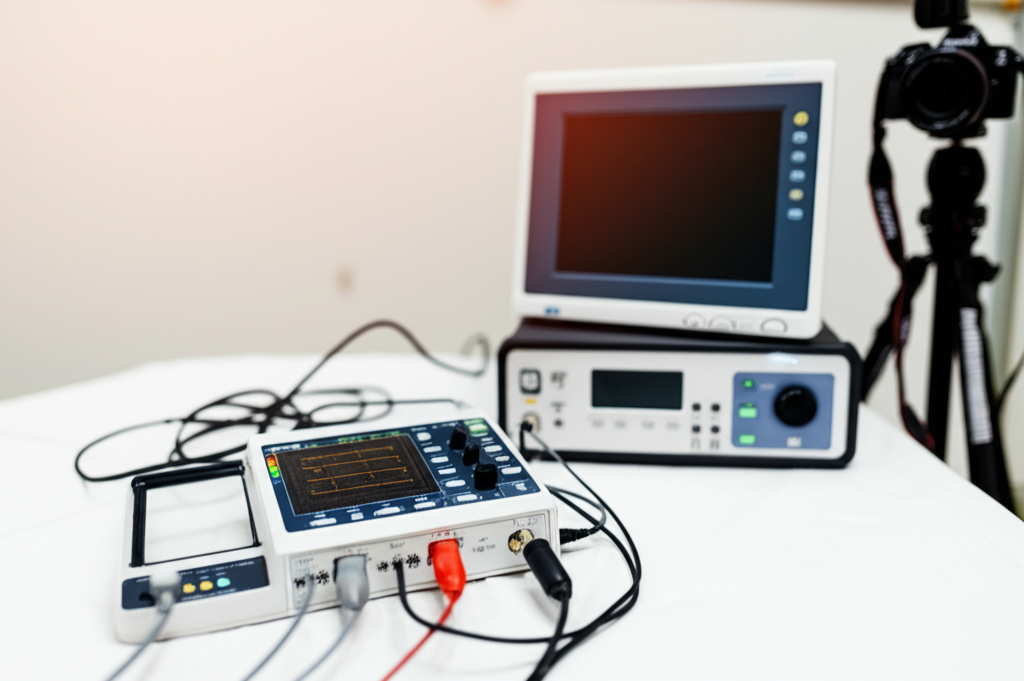
Testing environment is a standard setting across all studies. The setting includes a dark room illuminated with a controlled LED light, a conventional RGB video recorder (e.g., iPhone camera, Go Pro, Basler) and a 3-lead electrocardiograph (ECG). Figure 1 displays the set up of materials and the way in which subjects were positioned during the test.
Test Procedure: Heart Rate & Mental Stress Index
Subjects were asked to remain still and face the camera during the test for 2 minutes. Video and ECG recordings were synchronized to start and stop at the same time.
Analysis of Accuracy & Reliability: Heart Rate & Mental Stress Index
Extraction of facial blood flow is done for each video using TOI. When predicting values for HR and MSI, they are compared against ground truth ECG data collected by the BIOPAC to evaluate the accuracy of the signal.
Figure 4: Labeled ECG Wave
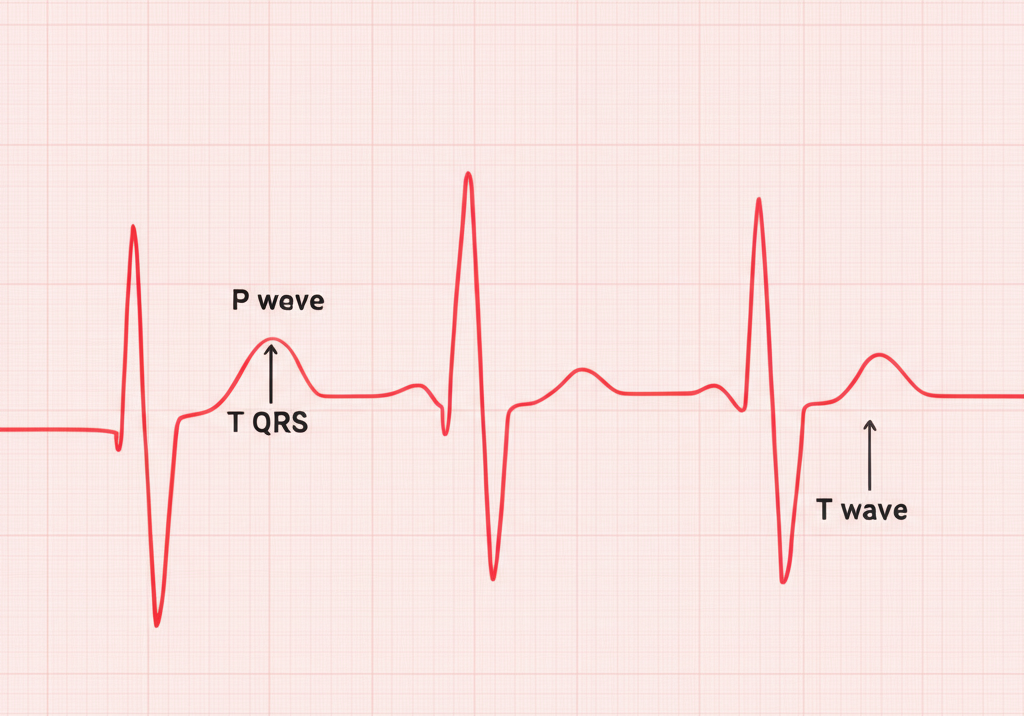
Figure 5: R-R Interval
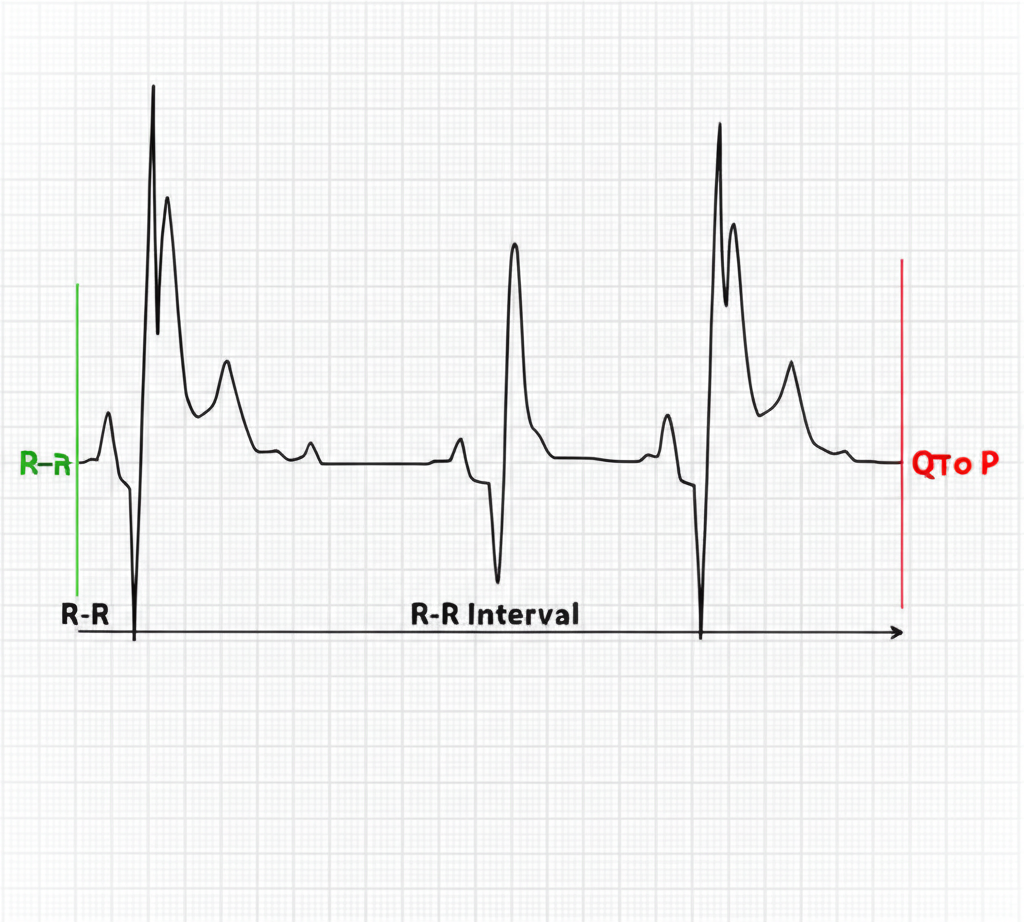
The figures above show the details of an ECG recording components. In healthy individuals, each Heartbeat recorded by an ECG device is determined by the R waves (peaks). As a result, the number of R waves per minute represent the rate at which a heart is beating.
TOI heart rate is determined for each individual, which is compared to ECG HR. Equation 1 is used to calculate the accuracy of TOI heart rate.
1 - (1/N) ∑ |Predicted HR - Actual HR| / |Actual HR| × 100%
Equation 1: Calculation of TOI heart rate accuracy
Stress is then derived based the heart rate variability over a period of time based on the inter-beat intervals (RRI) of the ECG recording or TOI signals (Figure 8).
1 - (1/N) ∑ |Predicted MRRI - Actual MRRI| / |Actual MRRI| × 100%
Equation 2: Calculation of TOI stress accuracy
Breathing
Tests on the data quality of breathing was carried out in a normal and indoor environment. All tests were conducted by researchers with experience in data collection, signal processing, and machine learning.
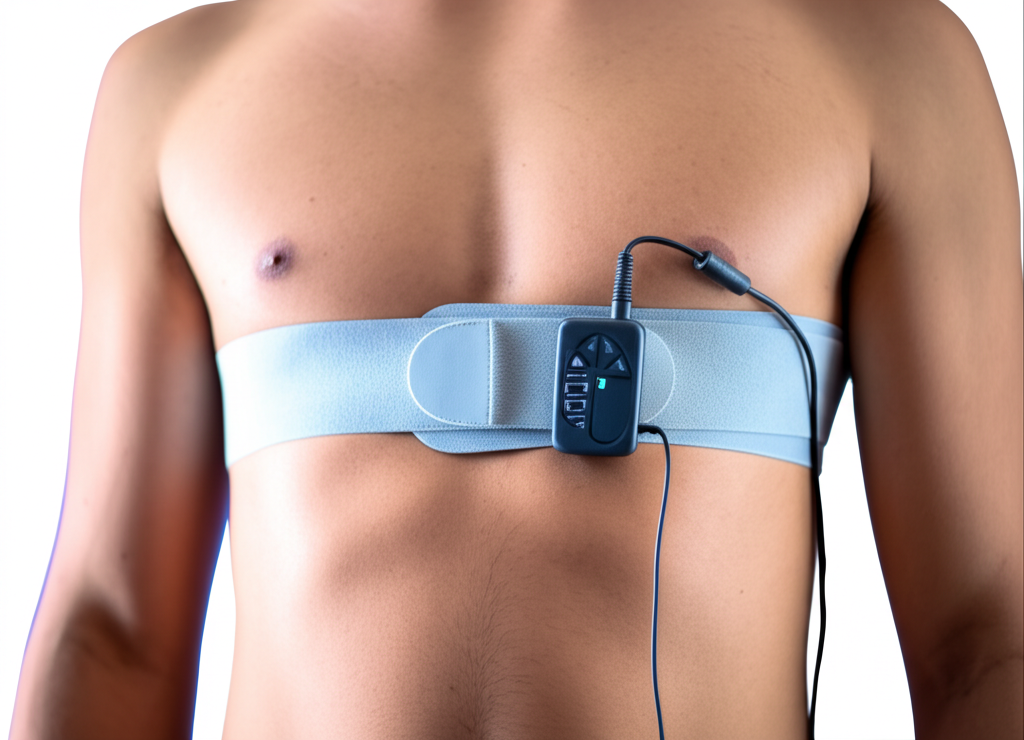
Figure 2: Breathing Test Setup
Test Population
Over 10,000 test subjects took part in the test. The subjects were recruited from the Affiliated Hospital of Hangzhou Normal University in China and the University of Toronto in Canada. There were no exclusion criteria when recruiting participants, although most participants were healthy adults above 18 years of age.
Table 4: Characteristics of Population for Breathing
| Participants Composition | Value |
|---|---|
| Standard deviation of age | 15.2 |
Test Setup: Breathing
Testing environment is a standard setting across all studies. The setting includes a dark room illuminated with a controlled LED light, a conventional RGB video recorder (e.g., iPhone camera, Go Pro, Basler) A breathing belt was attached around the thoracic region of subjects and connected to the Biopac device.
Test Procedure: Breathing
Subjects were asked to remain still and face the camera during the test for 2 minutes. Video and ECG recordings were synchronized to start and stop at the same time.
Analysis of Accuracy & Reliability: Breathing
Extraction of facial blood flow is done for each video using TOI. When predicting values for breathing, they are compared against ground truth data collected by the BIOPAC to evaluate the accuracy of the signal.
Blood Pressure
Tests on the data quality of blood pressure (BP) was carried out in a controlled indoor environment. The blood pressure of recruited subjects was first predicted by TOI using the Anura app, then measured using a mercury sphygmomanometer by an experienced nurse.
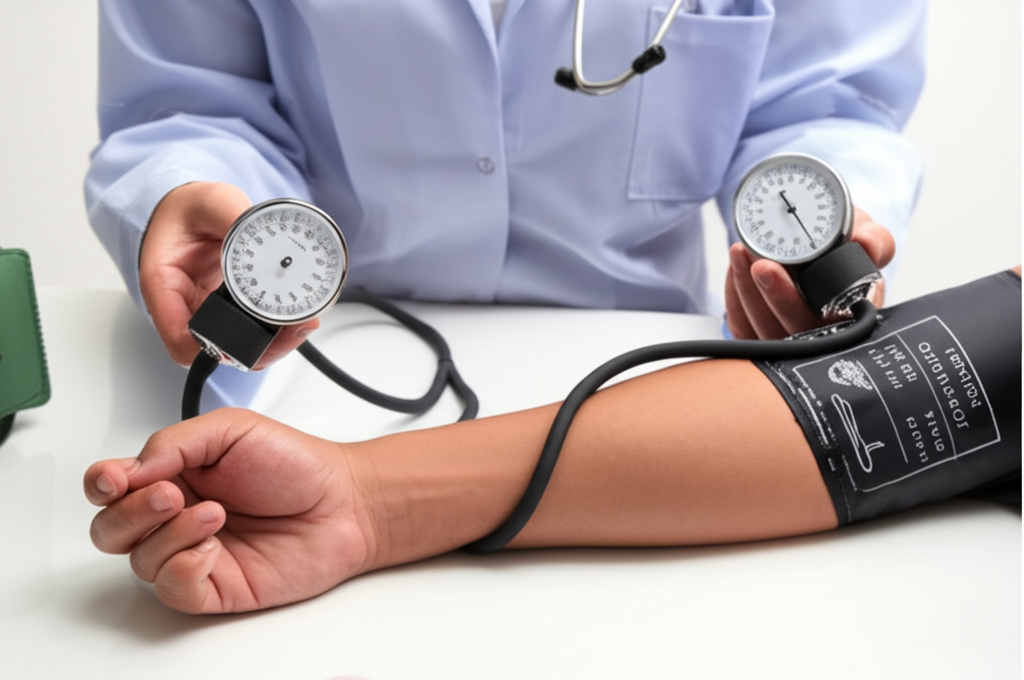
Figure 3: Blood Pressure Test Setup
Test Population: Blood Pressure
A sample of 85 adults were recruited. The subjects were recruited from the General Clinic of the Zhejiang Elderly Guanhai Hospital and the ECG Clinic of the Affiliated Hospital of Hangzhou Normal University, Hangzhou, China.
Table 5: Characteristics of population for BP
| Participants Composition | Value |
|---|---|
| Standard deviation of age | 14.1 |
Test Setup: Blood Pressure
The testing environment is a standard setting. The setting includes a quiet room illuminated with a controlled LED light, an iPhone with the Anura application, and a mercury sphygmomanometer. Figure 3 displays the set up of materials and the way in which subjects were positioned during the test.
Test Procedure: Blood Pressure
Blood pressure was first measured using the Anura application on the iPhone followed by a measurement using the mercury sphygmomanometer as a reference. Specifically, blood pressure was measured on the Anura test device by triggering a 60 second BP measurement with a button on the screen. The subject was asked to face the iPhone and remain perfectly still for the duration of the recording. The nurse then immediately measured a reference BP via auscultation with the mercury sphygmomanometer. Systolic BP (SBP) was measured as the pressure corresponding to the onset of the 'tapping' sound and Diastolic BP (DBP) as the pressure corresponding to the disappearance of the last audible Korotkoff sound.
The first measurement pair was designated as a practice measure and discarded. Three additional measurement pairs were then taken. The SBP and DBP for each auscultation were recorded to the nearest 2mmHg. If Korotkoff sounds were difficult to distinguish or the subject moved during a measurement, then that measurement pair was discarded and another one was taken. Measurement pairs continued (up to a maximum of eight) until three valid pairs were obtained. Subjects with arrhythmia were excluded, where three satisfactory measurement pairs could not be obtained, or where the SBP or DBP range was more than 12mmHg or 8 mmHg, respectively.
Analysis of Accuracy & Reliability: Blood Pressure
Blood pressure data was analyzed according to two AAMI criteria. For criterion 1, the mean difference (bias) between the reference measurement and the Anura measurement (reference – Anura) and its standard deviation across all 255 measurement pairs for both SBP and DBP. The device fulfils criteria 1 if the mean error is within 5 mmHg of zero and its standard deviation is less than or equal to 8 mmHg. For criterion 2, we calculated the average mean difference for each subject, and then calculated the mean and standard deviation of this value across all 85 subjects. The test device fulfils criteria 2 if its standard deviation is below a given cut-off (based on the mean difference) listed in a table in the ANSI/AAMI/ISO 81060-2:2013 guidelines.
Cardiovascular Disease Risk Prediction
This tool calculates an individual's probability of having a first heart attack, first stroke, or first heart attack or stroke (which we term 'cardiovascular disease') within a specified number of years.
Current Method: Cox Regression-based Model
Cardiovascular disease risk prediction is performed using two methods:
Current method: Cox regression-based model
Predicts the following:
- 10-year risk of cardiovascular disease (first heart attack or first stroke)
- 10-year risk of first heart attack
- 10-year risk of first stroke
Cox regression is the same methodological approach used in deriving the Framingham Heart Study risk prediction equations. It is also the same approach used in deriving the China-PAR equation, which is the gold standard for predicting cardiovascular disease risk in the Chinese population.
We derived two versions of each equation: one using a minimal set of risk factors and another using a full set, depending on how much information the user provides. These sets are listed in Tables 1 and 2.
Table 1: Minimal Set of Risk Factors
| Risk Factor Set: Minimal |
|---|
| Age (years) |
| Body Mass Index (kg/m²) |
| Systolic blood pressure (mmHg) |
Table 2: Full Set of Risk Factors
| Risk Factor Set: Full set |
|---|
| Age (years) |
| Body Mass Index (kg/m²) |
| Systolic blood pressure (mmHg) |
| Are you currently a smoker? (yes/no) |
Upcoming Method: Machine Learning-based Model
Upcoming method: Machine learning-based model
This model predicts the likelihood of an individual having a first heart attack or stroke within a specified number of years (from 2 to 20 years). It was derived using advanced machine learning techniques.
Cardiovascular disease is defined as: heart attack, stroke, or CHD death.
Test Population: Cardiovascular Disease Risk Prediction
Current method: Cox regression-based model
Models were both derived and tested on a sample of 4500 Chinese adults.
Upcoming method: Machine learning-based model
Models were derived and validated using a multi-racial dataset of over 30,000 adults from the United States, obtained over a period of 20 years. Training and validation occurred on separate portions of the dataset to minimize potential for 'overfitting.'
Test Procedure: Cardiovascular Disease Risk Prediction
Participants answered a survey with relevant questions about risk factors and cardiovascular disease status. The systolic blood pressure risk factor was measured (taken as the average of 3 measurements).
Emotions
Tests on the data quality of emotions (happiness, sadness, fear, disgust, surprise, and anger) were carried out using videos from people naturalistically expressing various emotions on their face.
Test Population: Emotions
A sample of adults were analyzed for their genuinely expressed emotions shown in videos. Tests on the data quality of emotions were conducted in Toronto, Canada by using videos from people naturalistically expressing various emotions (happiness, sadness, fear, disgust, surprise, and anger) on their face. All tests were conducted by researchers with experience in facial expression decoding and machine learning.
Table 6: Characteristics of Population for Emotion Expression
| Subjects in videos Composition | Value |
|---|---|
| Standard deviation of age | 10.5 |
Test Setup: Emotions
The test involved videos taken under various natural settings.
Test Procedure: Emotions
Videos of people expressing different genuine and posed emotions were downloaded from websites that offer non-licensed video datasets for research or machine learning validation purposes. The criteria of videos included a front view of a person with an emotion being expressed.
To produce genuine emotional expressions, individuals were asked to view various stimuli (e.g., a giggling baby, a dirty toilet bowl) that were known to elicit specific emotions. Their natural reactions were video recorded.
To produce posed emotional expressions, actors were coached to manipulate various facial muscles to mimic specific emotions as instructed by the researcher, which was video recorded.
Analysis of Accuracy & Reliability: Emotions
As for emotion expression, each video undergoes facial extraction second by second and then a prediction of each expression for each second is made by TOI. Each expression is given a percentage to which emotion it might be.
We decoded the likelihood ratios of all emotions on each video second by second and compared the decoded emotion against the actual emotion expressed in each video to obtain the accuracy (%) of whether the two were matched.
Note that 100% reliability was obtained by reanalyzing the same videos multiple times using the same algorithms with the initial frame.
Results
Summary of findings from TOI technology testing across different parameters
Heart Rate & Mental Stress Index
Heart Rate Accuracy
Correlation between TOI and ECG measurements: r=1.0 when SNR > 0
Heart Rate Reliability
Consistent results with repeated analysis of the same videos
Mental Stress Index Accuracy
Correlation with ECG measurements: r=0.94 (120s), r=0.88 (30s)
Table 7: Accuracy and Reliability of TOI Heart Rate and Mental Stress Index Data
| Physiological Measure | Accuracy (%) | Reliability (%) |
|---|---|---|
| Heart Rate | 99 | 100 |
| Mental Stress Index | 92 | 100 |
Accuracy & Reliability of Heart Rate
Table 8: Statistical Measure of TOI Heart Rate Accuracy
| HR Accuracy | Value |
|---|---|
| Mean ECG HR | 74.4 |
| Mean TOI HR | 75.1 |
| Mean Error | 0.63 |
| Standard Deviation of Error | 1.21 |
| Mean of Absolute Error | 0.79 |
The correlation between HR obtained from TOI and ECG was calculated. There was a positive correlation between the measurements of HR obtained from TOI and ECG, r=1.0 when SNR > 0. Figure 9 demonstrates the points of heart rate (BPM) as obtained from TOI and ECG with a line of best fit drawn through the points to illustrate the positive correlation.
Figure 9: Correlation between predicted values of heart rate from TOI and ECG
Accuracy & Reliability of Mental Stress Index
Table 9: Statistical Measure of TOI MSI Accuracy
| MSI Accuracy | Value |
|---|---|
| Mean ECG MSI | 3.87 |
| Mean TOI MSI | 3.20 |
| Mean Error | -0.67 |
| Standard Deviation of Error | 0.49 |
| Mean of Absolute Error | 0.73 |
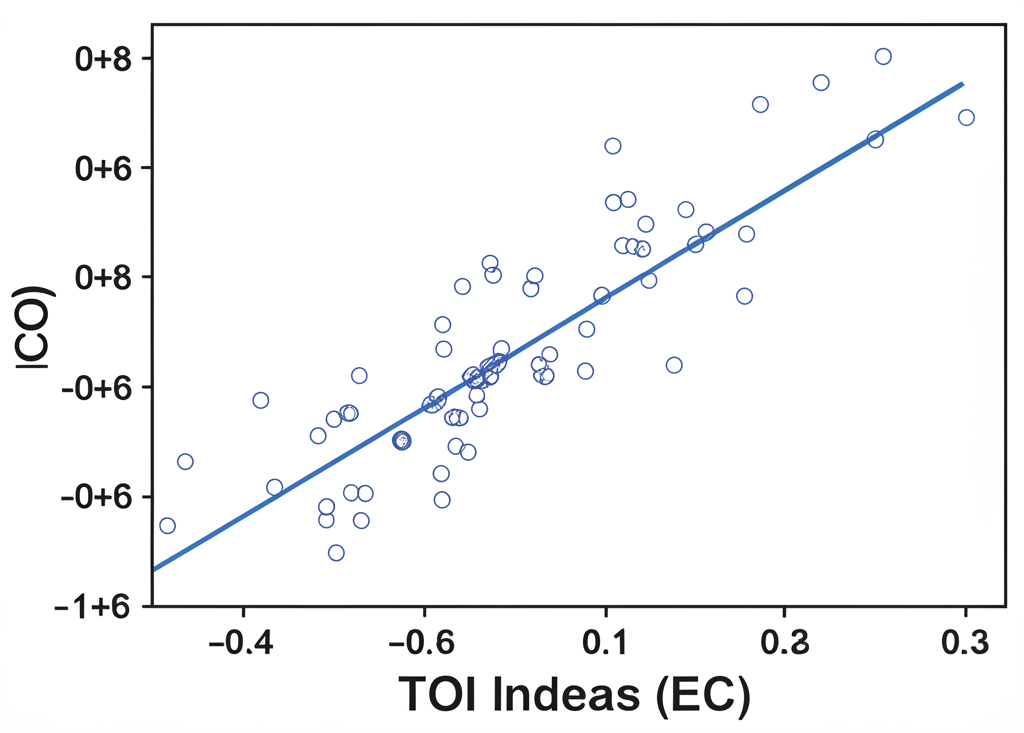
The correlation was calculated between stress measurements obtained from TOI and ECG during a 120 second time frame. There was a positive correlation, r = 0.94 when SNR > 0. Figure 10 demonstrates the points of stress as obtained from TOI and ECG with a line of best fit drawn through the points to illustrate the positive correlation.
Figure 10: Correlation between predicted values of stress from TOI and ECG over a period of 120 seconds
Figure 11: Correlation between predicted values of stress from TOI and ECG over a period of 30 seconds
The correlation was also calculated between stress measurements obtained from TOI and ECG during a 30 second time frame. There was a positive correlation, r = 0.88 when SNR > 0. Figure 11 demonstrates the points of stress as obtained from TOI and ECG with a line of best fit drawn through the points to illustrate the positive correlation.
Breathing
Breathing Accuracy
Correlation with BIOPAC measurements: r=0.9 when SNR > 0
Breathing Reliability
Consistent results with repeated analysis of the same videos
Table 10: Accuracy and Reliability of Predicted Breathing
| Physiological Measure | Accuracy (%) | Reliability (%) |
|---|---|---|
| Breathing | >90 | 99 |
The correlation was calculated between breathing measurements obtained from TOI and BIOPAC. There was a positive correlation, r = 0.9 when SNR > 0.
Blood Pressure
Table 11: Blood Pressure Validation Results
| Anura BP | mean±SD (min–max) |
|---|---|
| SBP (mmHg) | –0.4±6.7 (94–176) |
| SBP (mmHg) | –0.4±5.8 (97–169) |
The mean difference between BP measurements from the mercury sphygmomanometer and Anura are presented in Table 11. The model was evaluated according to two AAMI criteria.
Figure 13: Standardized Bland–Altman scatterplot of differences between device (Anura) and observer measurements
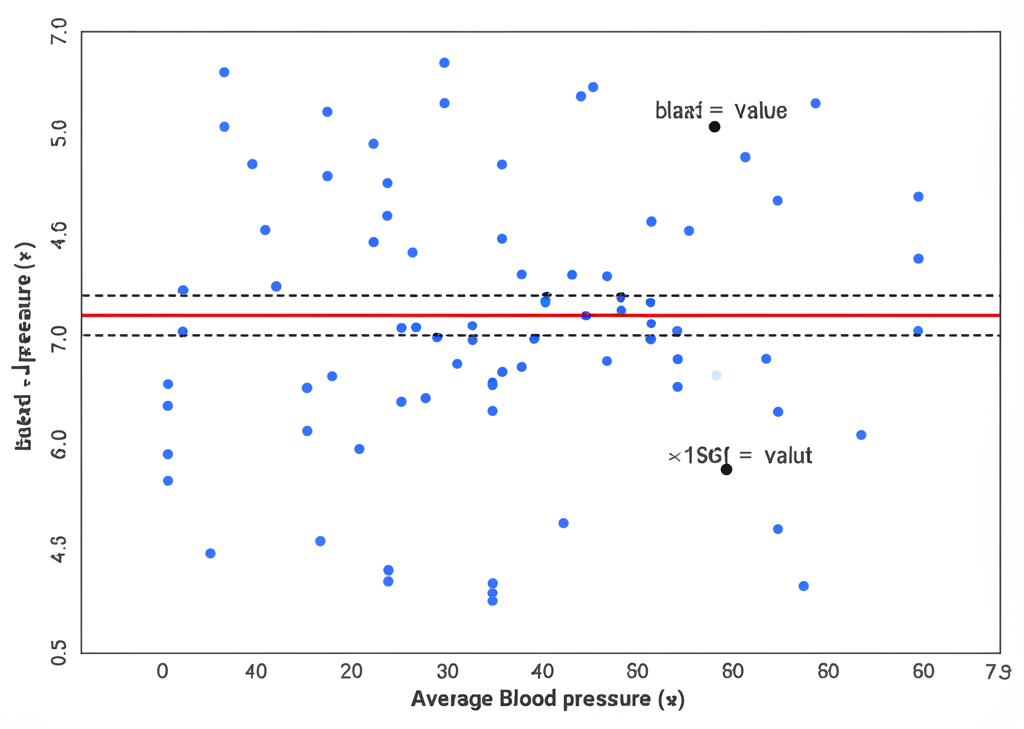
The model performance was visualized using Bland–Altman plots in Figure 13. Predictions for SBP are best for reference pressures between 110 and 150mmHg. Predictions for DBP are best for reference pressures between 75 and 85 mmHg.
Cardiovascular Disease Risk Prediction
Current: Cox-based Regression
Internal validation: AUC overall (n=4500) = 0.72
Figure 14: Validation against China-PAR Equation

Upcoming: Machine Learning-based Model
Table 12: Accurate Predictions for Time Windows
| Time Window | AUC |
|---|---|
| 2-year | 0.82 |
| 5-year | 0.81 |
| 10-year | 0.80 |
| 15-year | 0.79 |
| 20-year | 0.78 |
Figure 15: 10-year Risk Predictions

Emotions in Adults
Table 13: Accuracy of Genuinely Expressed Emotions
| Emotional Expressions | Accuracy (%) | Reliability (%) |
|---|---|---|
| Fear | 100 | 100 |
| Sadness | 100 | 100 |
| Happiness | 93 | 100 |
| Anger | 89 | 100 |
| Disgust | 86 | 100 |
| Surprise | 80 | 100 |
Table 14: Accuracy of Posed Emotions
| Emotional Expressions | Accuracy (%) | Reliability (%) |
|---|---|---|
| Fear | 80 | 100 |
| Sadness | 90 | 100 |
| Happiness | 95 | 100 |
| Anger | 89 | 100 |
| Disgust | 94 | 100 |
| Surprise | 89 | 100 |
Emotion Valence Validation in Adults
The multiple emotions that people express are classified into 3 categories, also referred to as emotion valences: positive, negative, and neutral.
Table 15: TOI Accuracy and Reliability of Predicting Emotion Valences
| Emotional valence | Accuracy (%) | Reliability (%) |
|---|---|---|
| Positive | 93 | 100 |
| Negative | 94 | 100 |
| Neutral | 86 | 100 |
Figure 21: Changes in Valence Prediction
